The MACD consists of the difference between two exponential moving averages
on 12-day and 26-day, respectively, which are plotted on an open scale
against the zero line. WinChart™ uses 26-day for MACD as the
default. The zero line represents the times when the values of the two
moving averages are identical. The MACD can be represented on the chart as a
line or as a histogram. In addition to this line, an additional 9-day
exponential moving average acts as a trigger or signal line. MACD is fairly
popular among traders.
Standard Construction of
the MACD:
MACD Line = 12 EMA - 26 EMA
Trigger Line = 9 EMA of MACD Line.
MACD Histogram = MACD line - Trigger line.
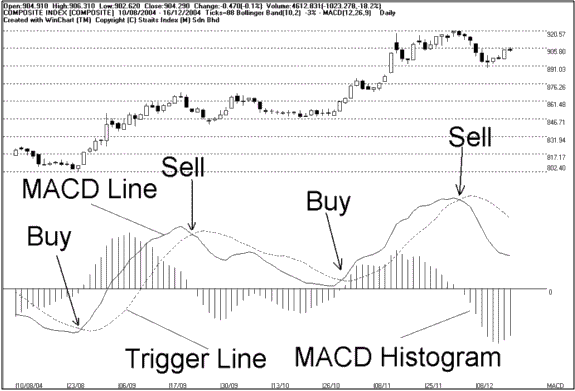
Interpretation of MACD:
When MACD line rises above the zero line, it suggests that long-term market
sentiment is good. As long as MACD line stays above the zero line, market
sentiment remains bright. Conversely if MACD line falls below the zero line,
it suggests that the long-term market sentiment is bearish.
When MACD cut above the trigger line, it gives a buy signal. When MACD cut
below the trigger line, it gives a sell signal.
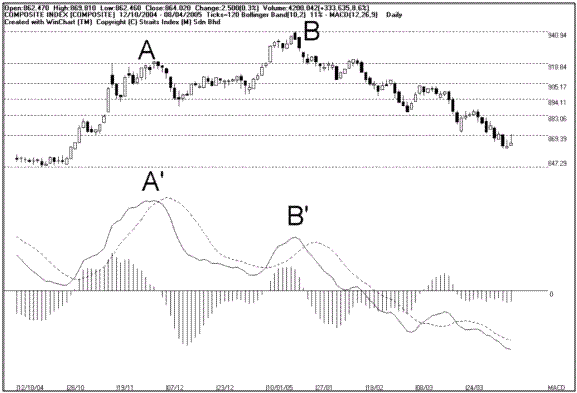
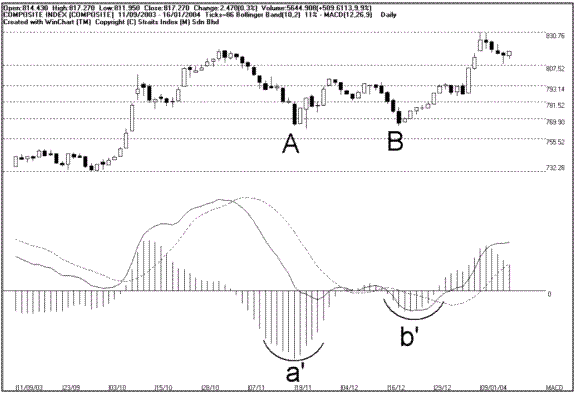
When MACD histogram shows a ¡°round bottom¡±, it suggests that the market is
having a correction or consolidation where price temporary stop falling.
When MACD histogram shows a ¡°round top¡±, it suggests that the market is
having a correction or consolidation where price temporary stop rising.
Use MACD to look for divergence signal is rather effective. Divergences
signals can be found in both the MACD line as well as the histogram.
MACD bearish divergence.
MACD histogram bullish divergence.