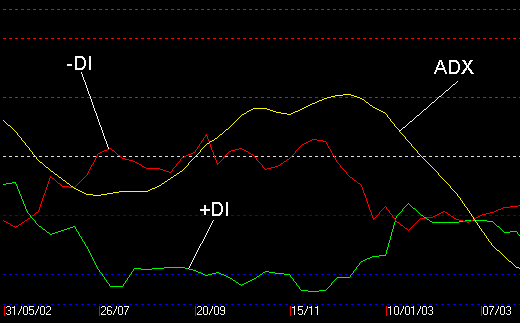
DMI consists of three lines, there are +DI line, -DI line and ADX line :-
+DI : current positive directional index, the range of highs divided by the price range over the last day and previous close, smoothed over a given number of periods. (Green line)
-DI : current negative directional index, the range of lows divided by the price range over the last day and previous close, smoothed over a given number of periods. (Red line)
ADX : modified moving average of the difference of +DI and -DI divided by the sum of +DI and -DI, multiplied by 100. (Yellow line)
Construction of the DMI:
TR (True Range) =
The largest range from todayˇŻs High to low, todayˇŻs High to
yesterdayˇŻs close, or todayˇŻs low to yesterdays close.
ADX = 14 Moving Average of DX.
ˇˇ
|
+DI > -DI |
Strong Bull trend |
-DI > +DI |
Strong Bear trend |
|
+DI > -DI |
Weak Bull trend |
-DI > +DI |
Weak Bear Trend |
|
+DI > -DI |
Signal unclear |
-DI > +DI |
Signal unclear |
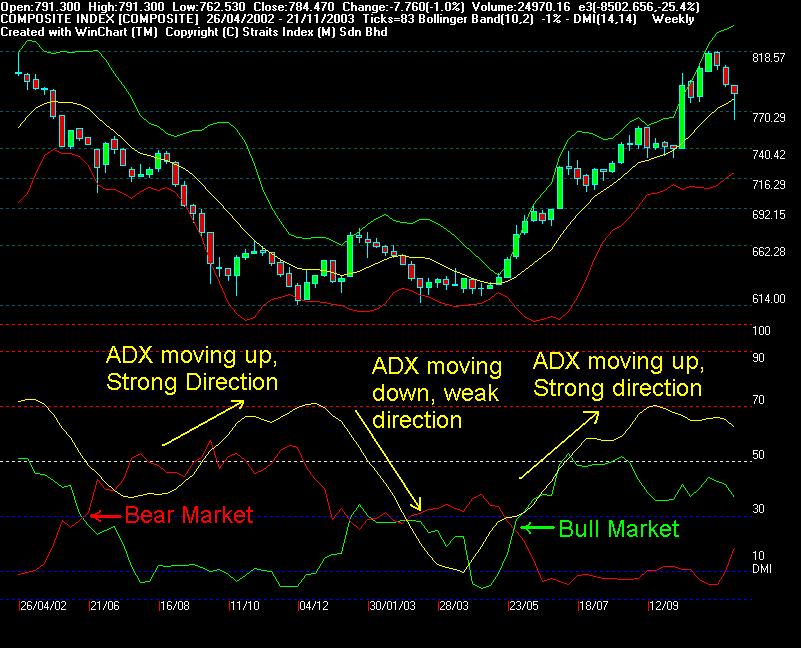
Example shown here is a KLCI weekly chart. As indicated, when the -DII cross above the + DI, a Bear Market signal is issue, then confirm with ADX. If ADX is moving higher, it suggests that the direction of the market is strong. If ADX is moving lower or flat, it suggest that the market direction is weak or unclear.
Copyright © 1997- 2005 Straits Index (M) Sdn Bhd. All rights reserved.