 |
||
|
|
WinChart
Case Study |
|
|
Understanding
WinChart PE |
|
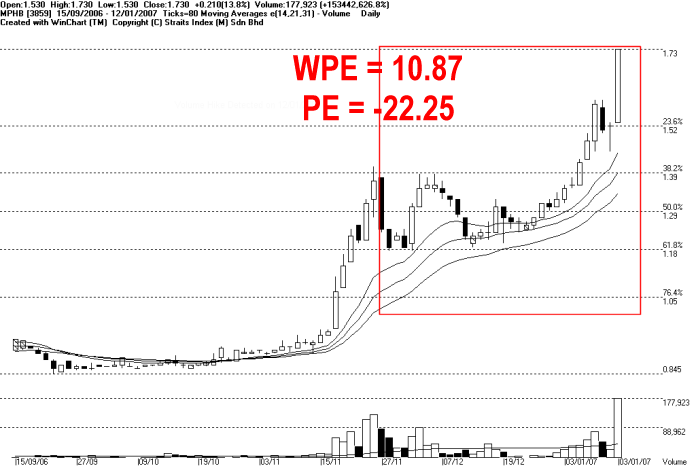
As highlighted by the red rectangular, WinChart GOLD is showing two different PE ratios ( WPE - WinChart PE and PE). As you see, the regular PE is showing -22.25 but WPE is showing 10.87. This is because the regular PE is a trailing or rolling PE calculation, and WPE is using Leading PE calculation. Take the example of the above stock, MPHB (Multi-Purpose Holdings Berhad) 3rd quarter WinChart GOLD. Regular PE calculation will take 2005Q4 + 2006Q1 + 2006Q2 + and 2006Q3. Because MPHB 2005Q4 reported a huge losses, and therefore, despite 3 quarters of 2006 were all profitable, regular PE still shows a negative figure. However, WinChart PE calculate 2006Q1, 2006Q2, and 2006Q3 earning, then divided by 3, and it shall be the estimated 2006Q4 earning, and take 2006Q1 + 2006Q2 + 2006Q3 + 2006Q4 (estimated). Since the 3 quarters of 2006, MPHB recorded profits, and therefore, WPE is showing a positive figure. There is no definition as to which type of PE is more accurate, it is merely a different view. The idea of WinChart PE is provided that the company futures earning remained similar, the current earning of the current financial year should reflect its company earning ratio better.
This is one of the unique features of WinChart Gold. Only WinChart Gold provides you with two different PE ratios. Chart above taken from 12/01/07, showing MPHB trending uptrend after the Financial Announcement dated 24/11/07. In regards to its PE, a conventional PE showing negative figures in this instance would be unable to reflect or relate to its recent price movement because the conventional PE sometime includes earning figures of the previous year, therefore it sometimes could be misleading. |
|
|
Important
Disclaimer: |
|
|
Copyright 1997-2006 Straits Index (M) Sdn Bhd, All Rights Reserved |
|
<WinChart GOLD Introduction> <Related Case Study 1: Figures and Ratio on WinChart GOLD> <Back to hart GWinCOLD>
|
|
|
|
|
|
|
|
|
|
No. 16, Jalan LP 1A
/ 5, Lestari Perdana, | |||||||
|
Copyright © 1998-2011 Straits Index (M) Sdn Bhd. All Rights Reserved | |||||||